Example Deformation Report: Vertical Displacement of Points on Overpass
I wanted to show you this sample deformation report for a fictitious overpass so you can see the quality of the reports I can generate for your company.
Deformation monitoring surveys are my specialty, but I also do data processing, calculations and reporting for other kinds of surveys as well.
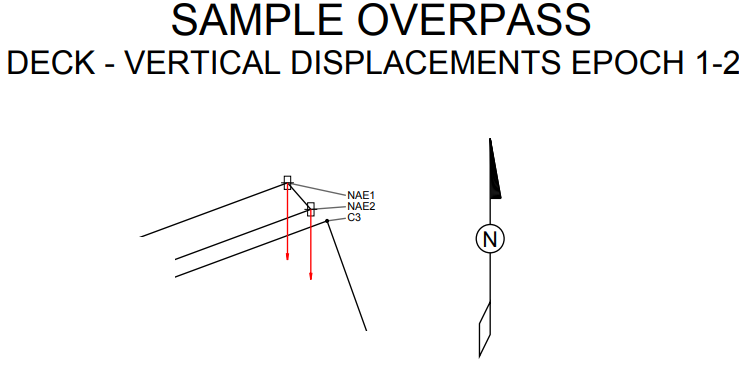
In this example, only significant vertical displacements between epochs 1 and 2 are shown.
My client typically creates a cover page and an executive summary and includes the PDFs that I generate, compiling it all into a complete report, also in PDF format.
Drawing 1 – Overview – an overview of the complete monitoring survey area, showing which points were stable and which were not, between the chosen epochs.
Drawing 2 – Bridge Deck – shows the magnitudes and directions of the vertical displacements of points on the bridge deck. This is the close up view.
Drawing 3 – Bridge Deck and Roadway – shows the vertical displacements of deck points and roadway points.
Table of Significant Vertical Displacements - Natural Language – a table of numbers, using English words like ‘stable’ and ‘subsided’
Table of Significant Vertical Displacements - Numerical – a table of numbers, easy to enter or copy into other software, using 0 for stable and – and + signs.
Thank you for checking out some of my work!
If you like these graphics and tables, I can generate reports like this for you as well.
I’ve been programming for 24 years and working in surveying for the past 13 years. I’ve worked for three surveying companies so far.
And I’m looking to generate reports for more Geomatics companies. I am also open to custom software projects. Please let me know if I help you.
My best,
Bevan Bird
Deformation
Monitoring Specialist
Award Winning Geomatics Engineering Technologist
Custom Software Developer
Creator of the DF (Data Functions) Programming Language